Explainers
A collection of diagrams and presentation materials developed by Dan Friedman to help explain Microsoft Fabric and Power BI concepts. These are designed to support workshops, customer conversations, internal enablement sessions, and self-guided learning.
What’s inside
All diagrams are authored in Excalidraw and stored as .excalidraw JSON files. You can open them directly at excalidraw.com (File → Open) or with the Excalidraw VS Code extension.
Diagrams
| Preview | Diagram | Description |
|---|---|---|
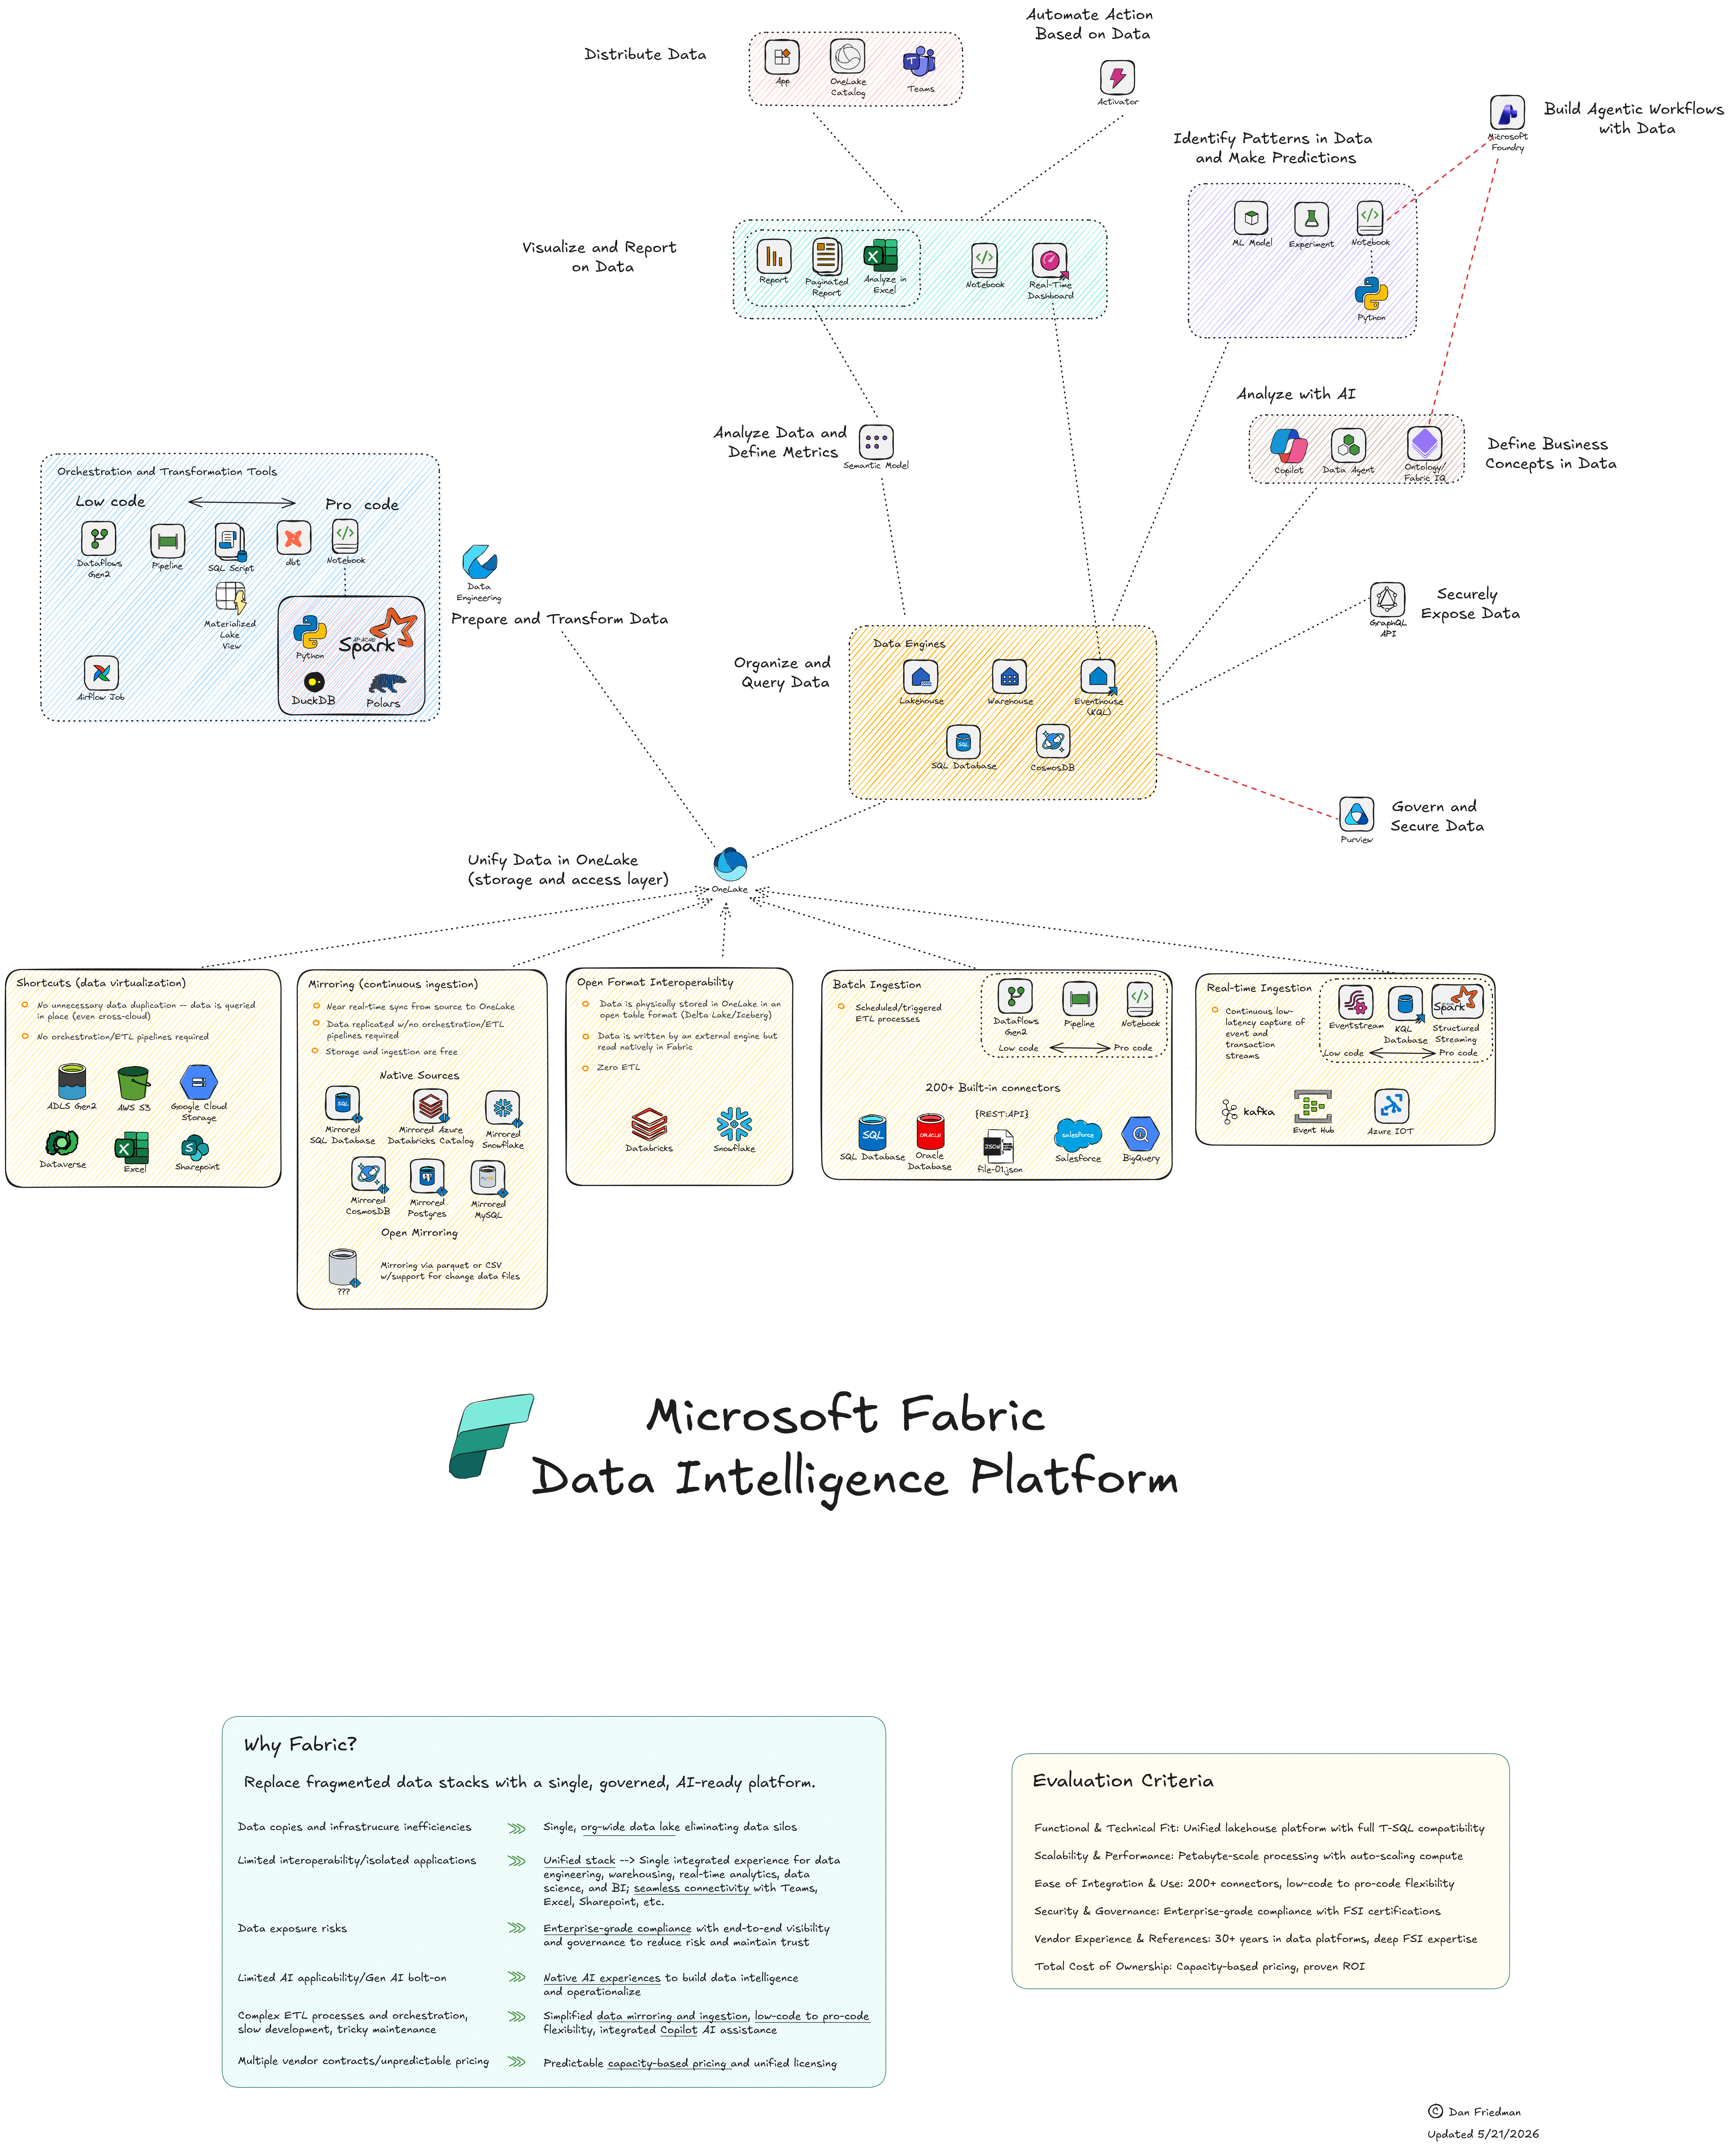 |
Fabric overview | High-level view of the Microsoft Fabric platform and its workloads. |
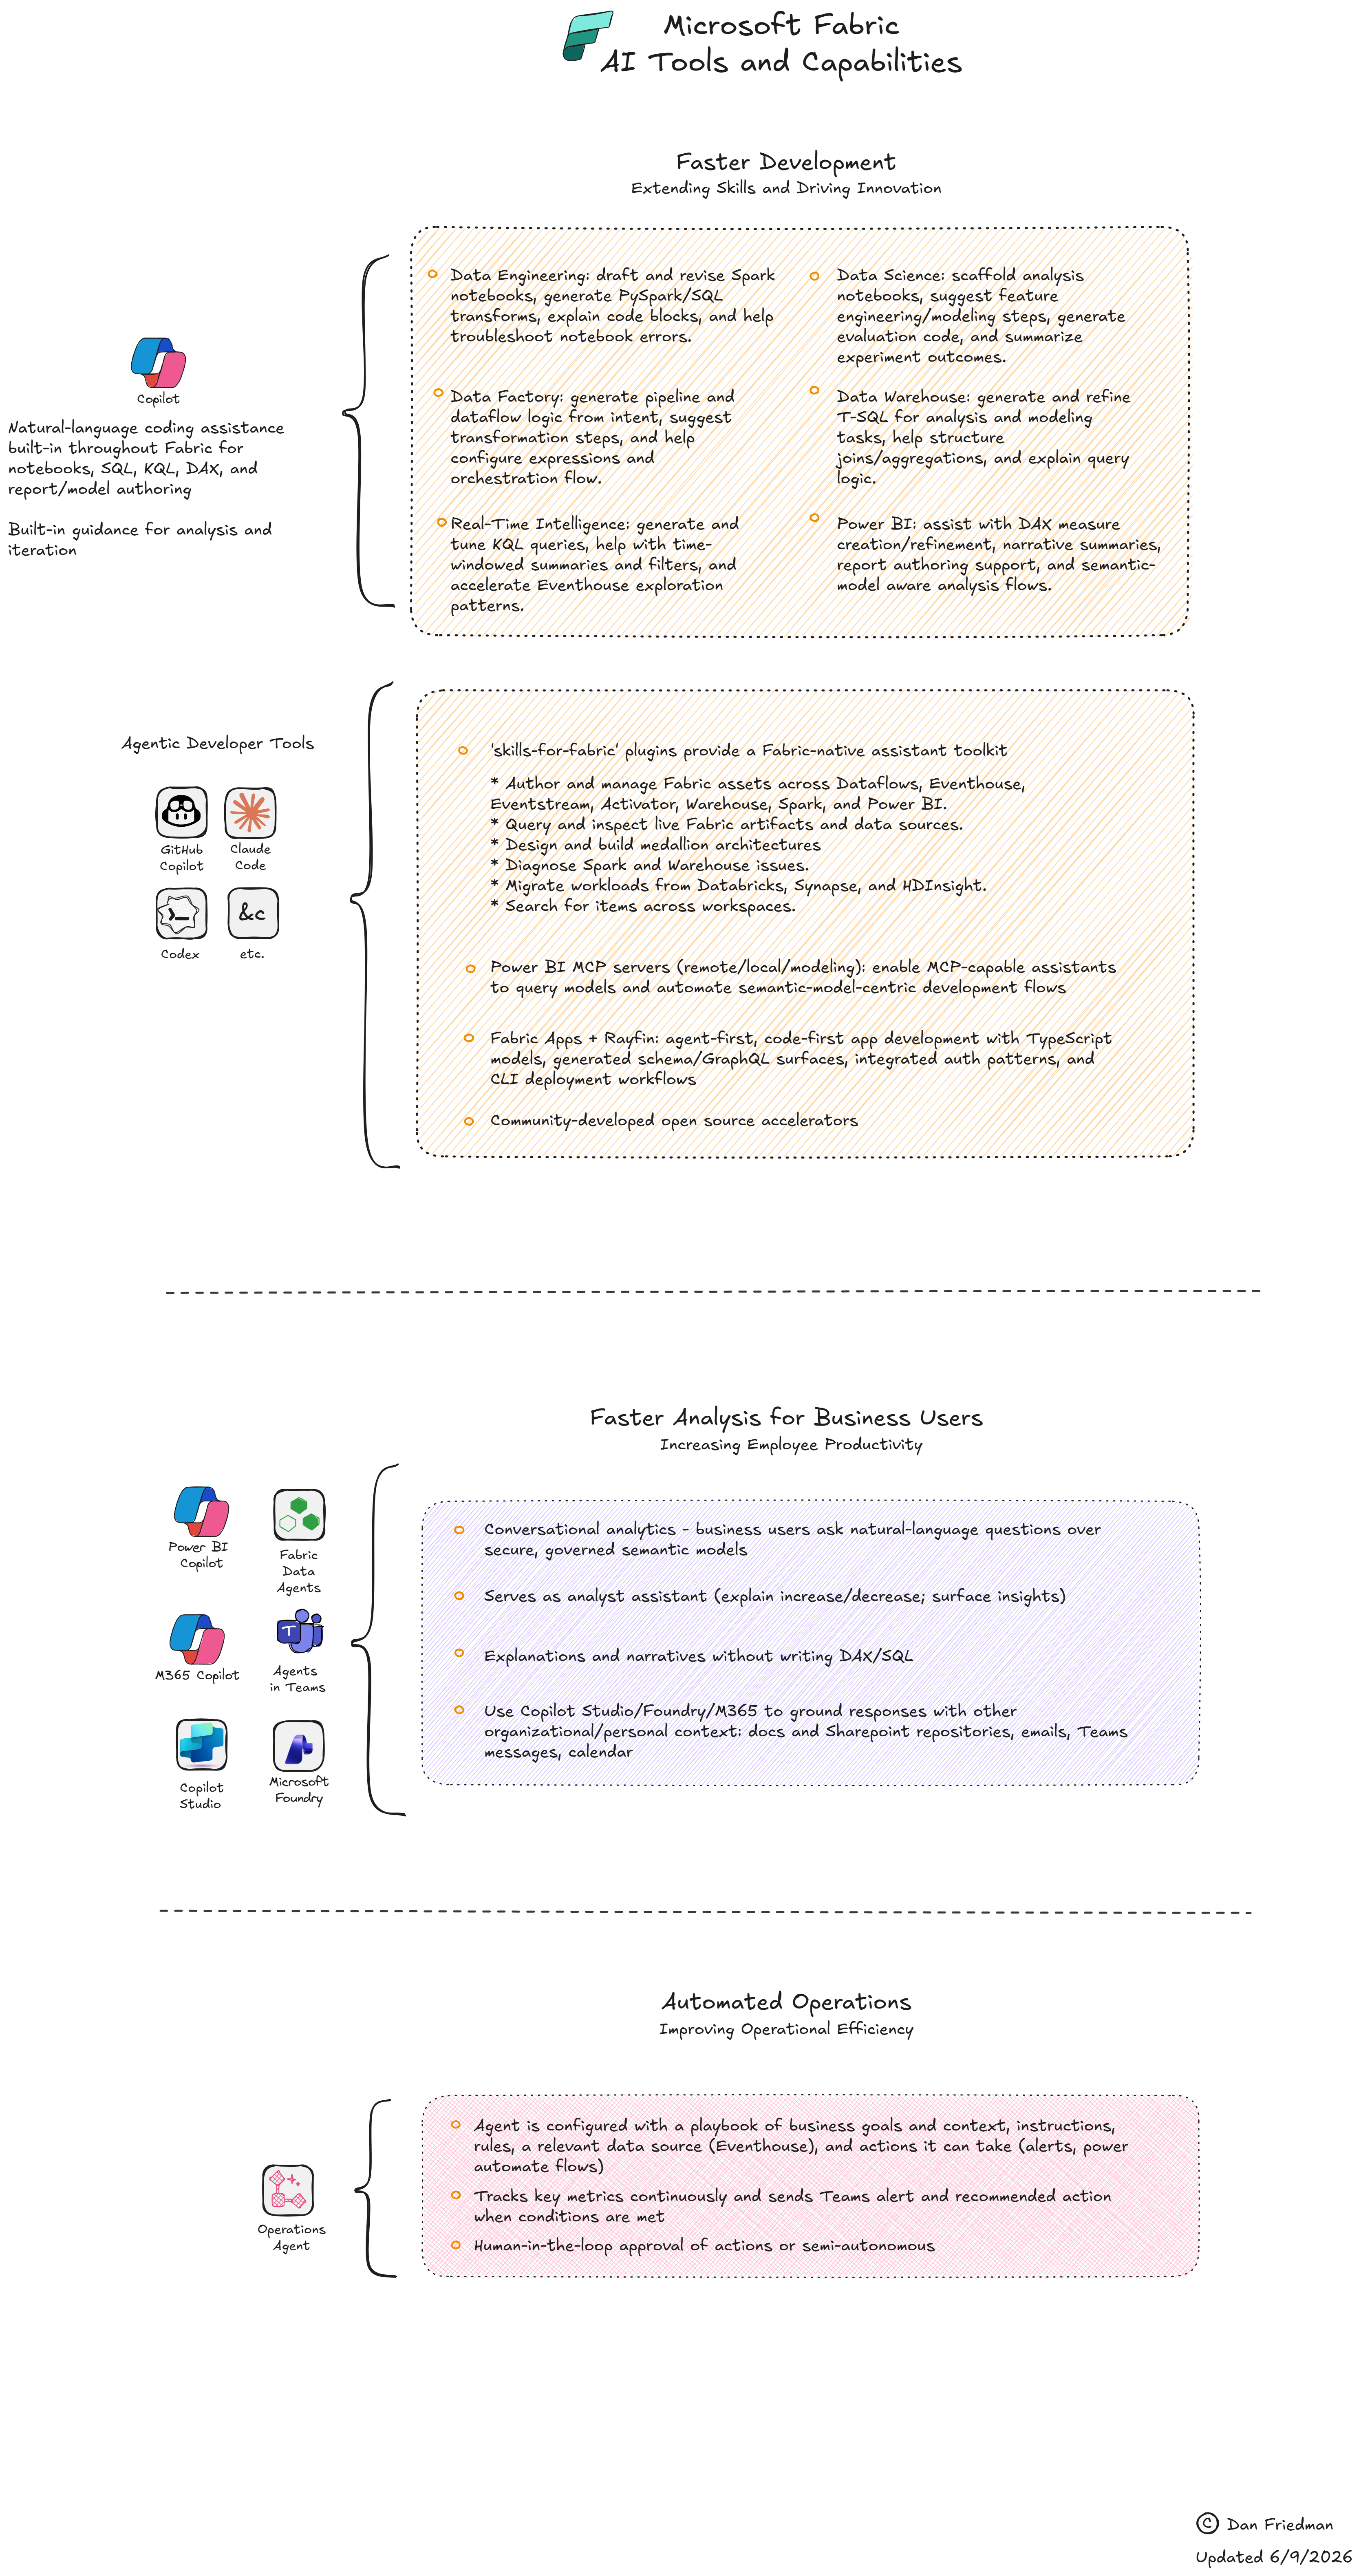 |
Fabric and AI tools | Map of Fabric workloads and AI tooling across development and analytics scenarios. |
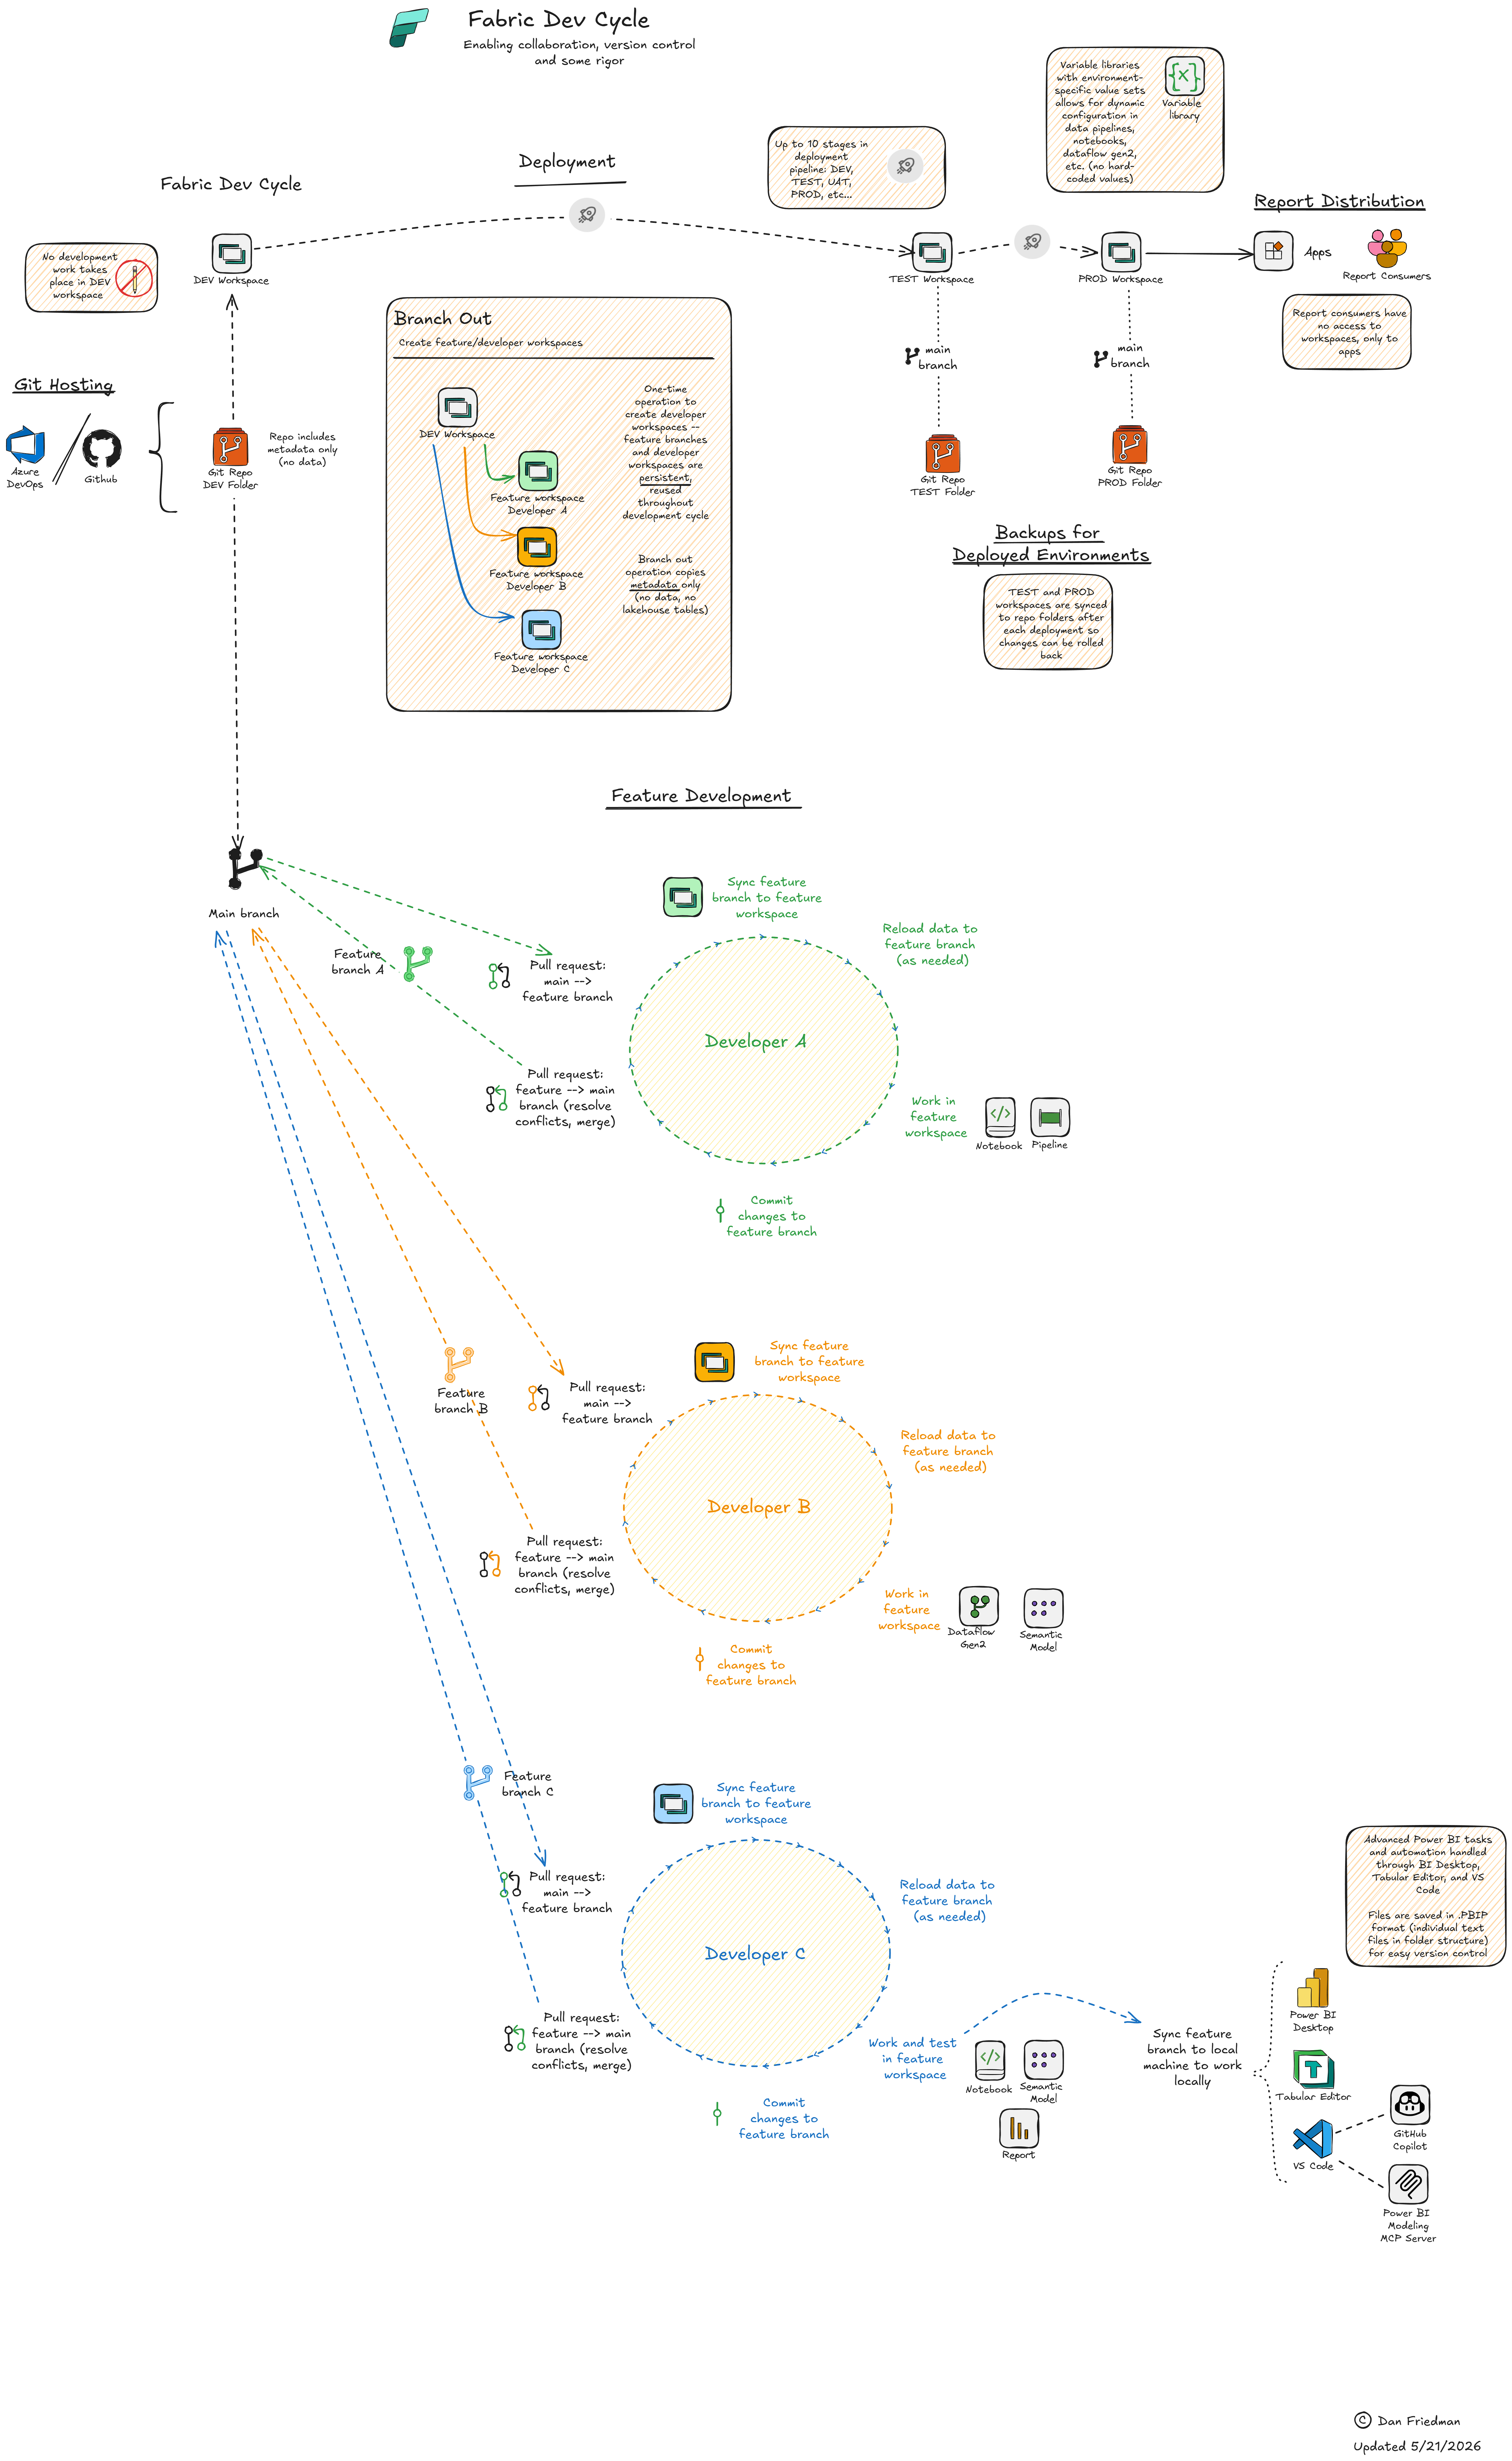 |
Fabric dev cycle | End-to-end development lifecycle for Fabric solutions. |
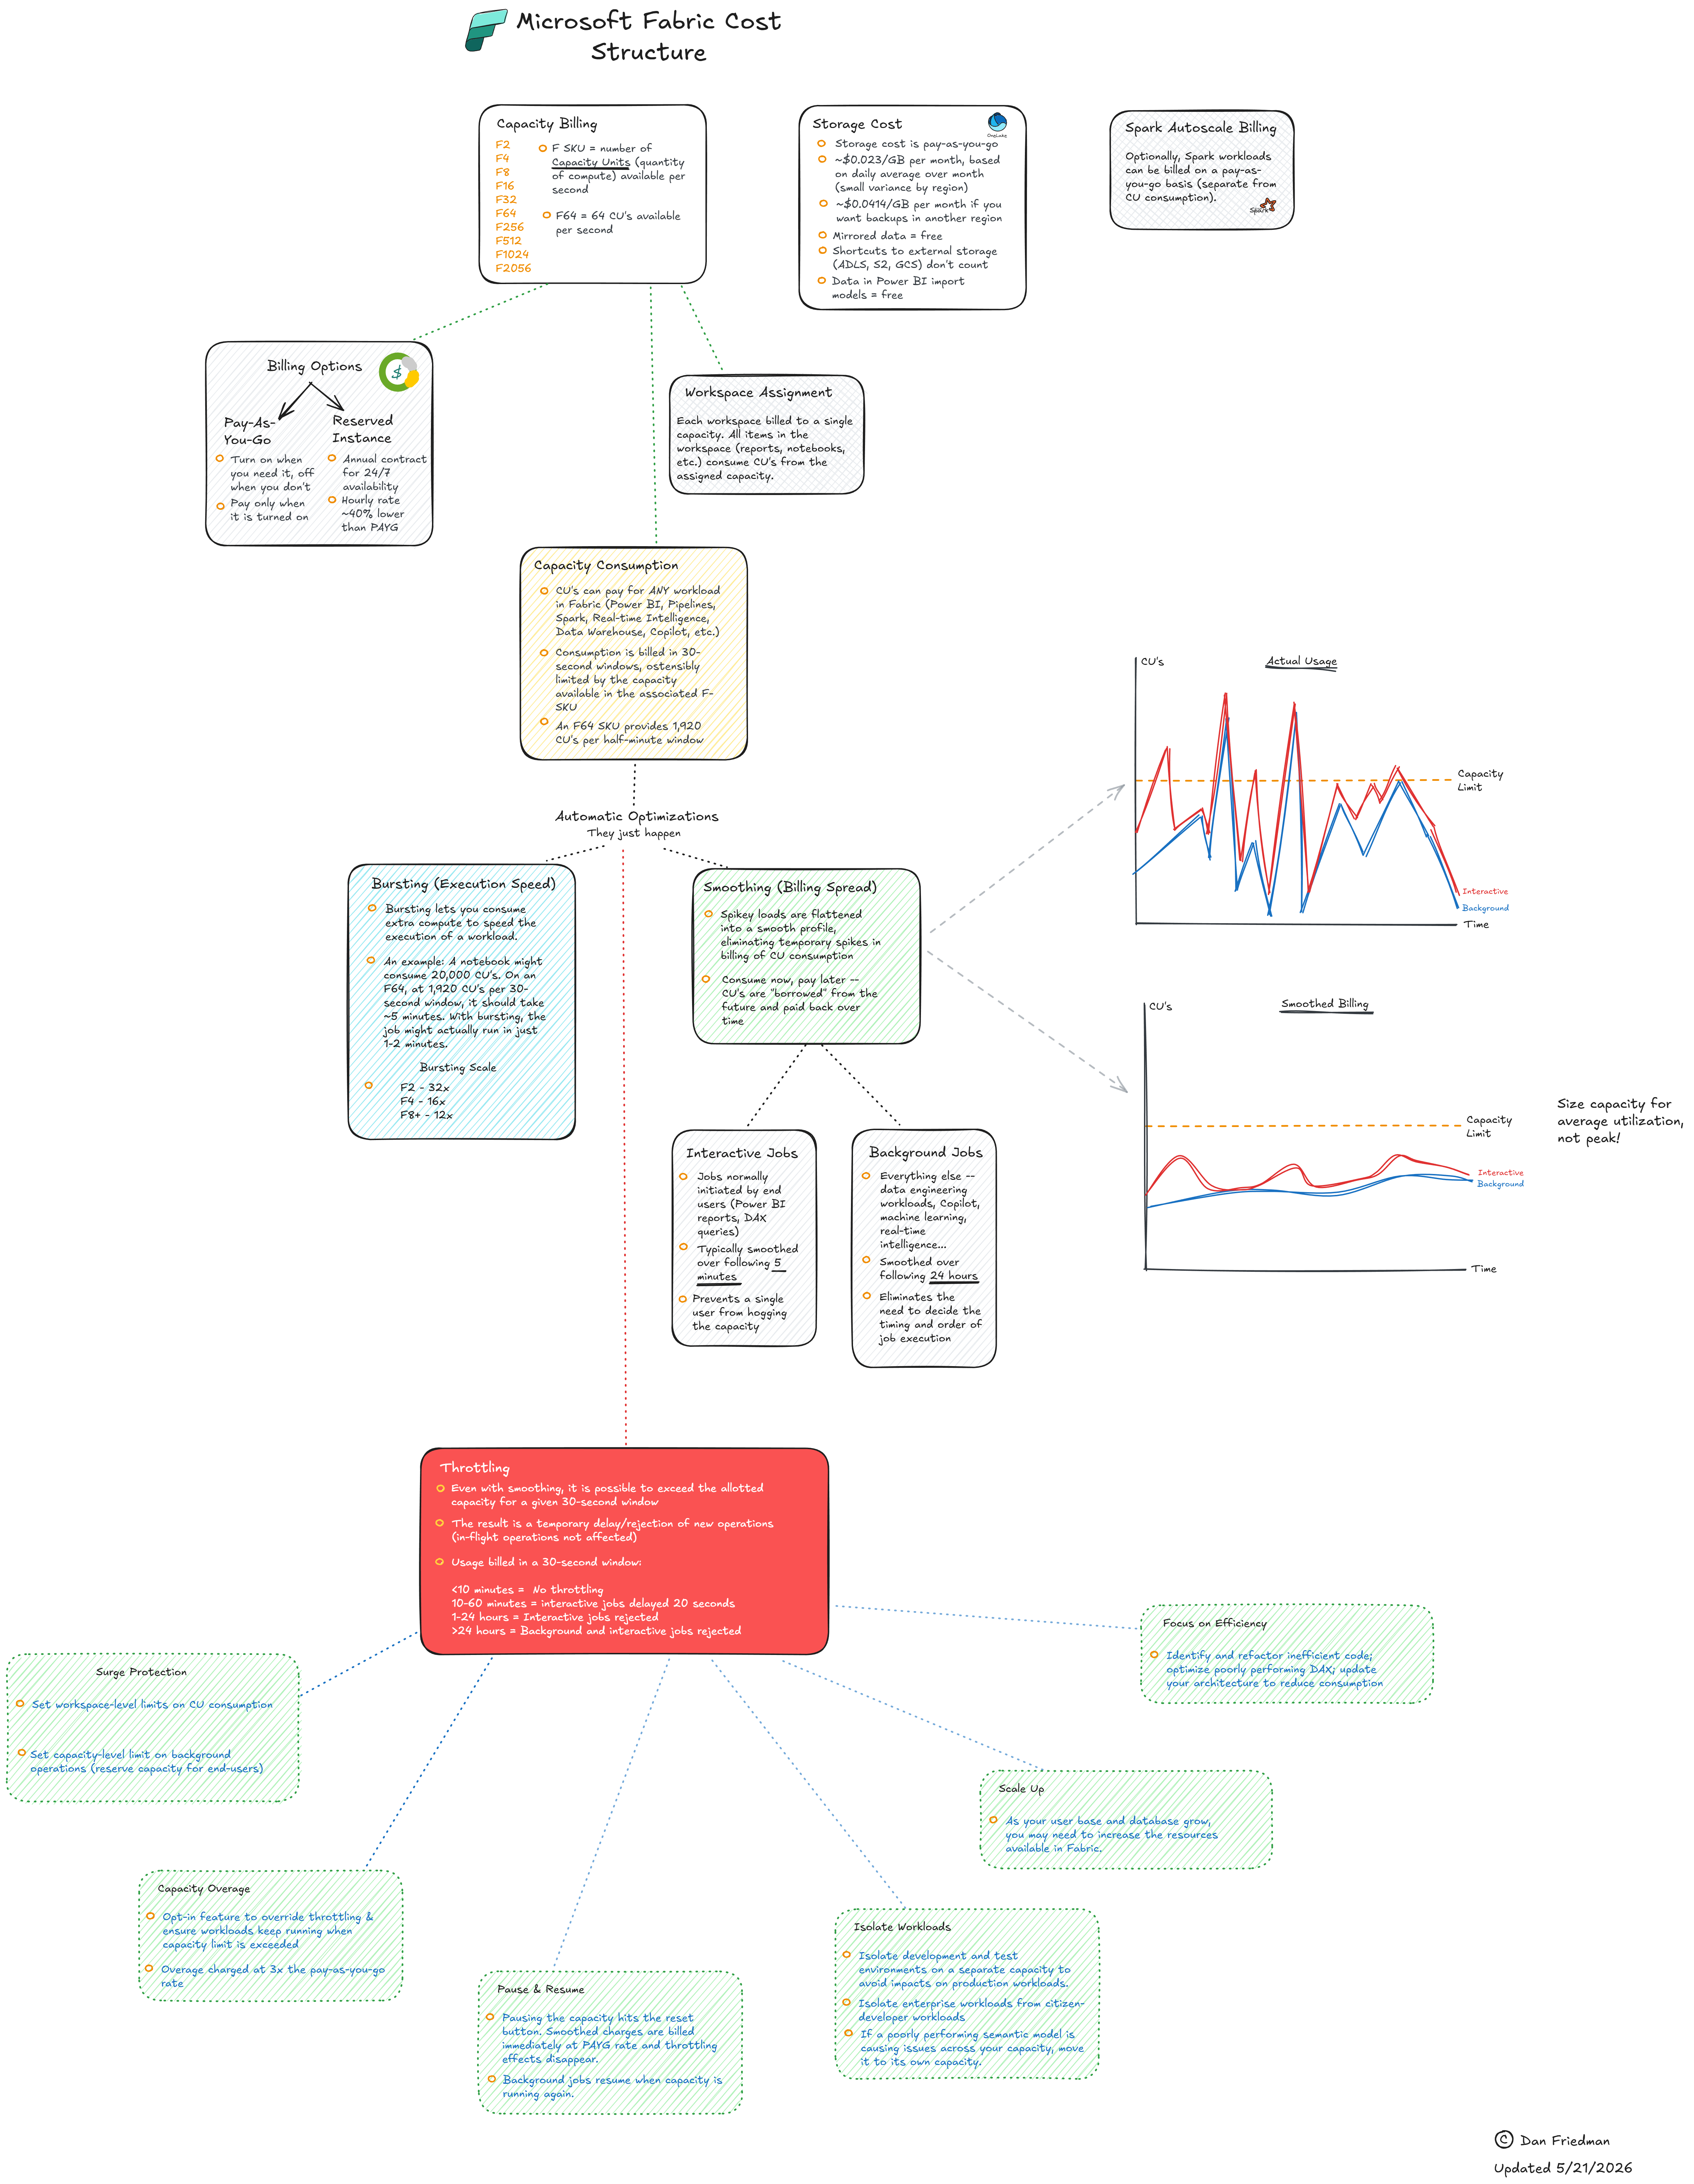 |
Fabric costs explainer | How Fabric capacity, consumption, and billing fit together. |
 |
Fabric governance and security | Governance, security, and access-control concepts in Fabric. |
 |
Power BI dev cycle | Development lifecycle for Power BI semantic models and reports. |
Preview images live in diagrams/previews/. See that folder’s README for export conventions.
How to use
- View or edit: Open any
.excalidrawfile in the Excalidraw web app or VS Code extension. - Export: From Excalidraw, export to PNG, SVG, or PDF for use in slide decks, docs, or wikis.
- Embed: Excalidraw SVG exports work well in Markdown, Loop, and PowerPoint.
Changelog
See CHANGELOG.md for a history of additions and changes.
Contributing / feedback
These are living documents — if you spot something inaccurate or have suggestions, feel free to open an issue or PR.
License
See LICENSE.